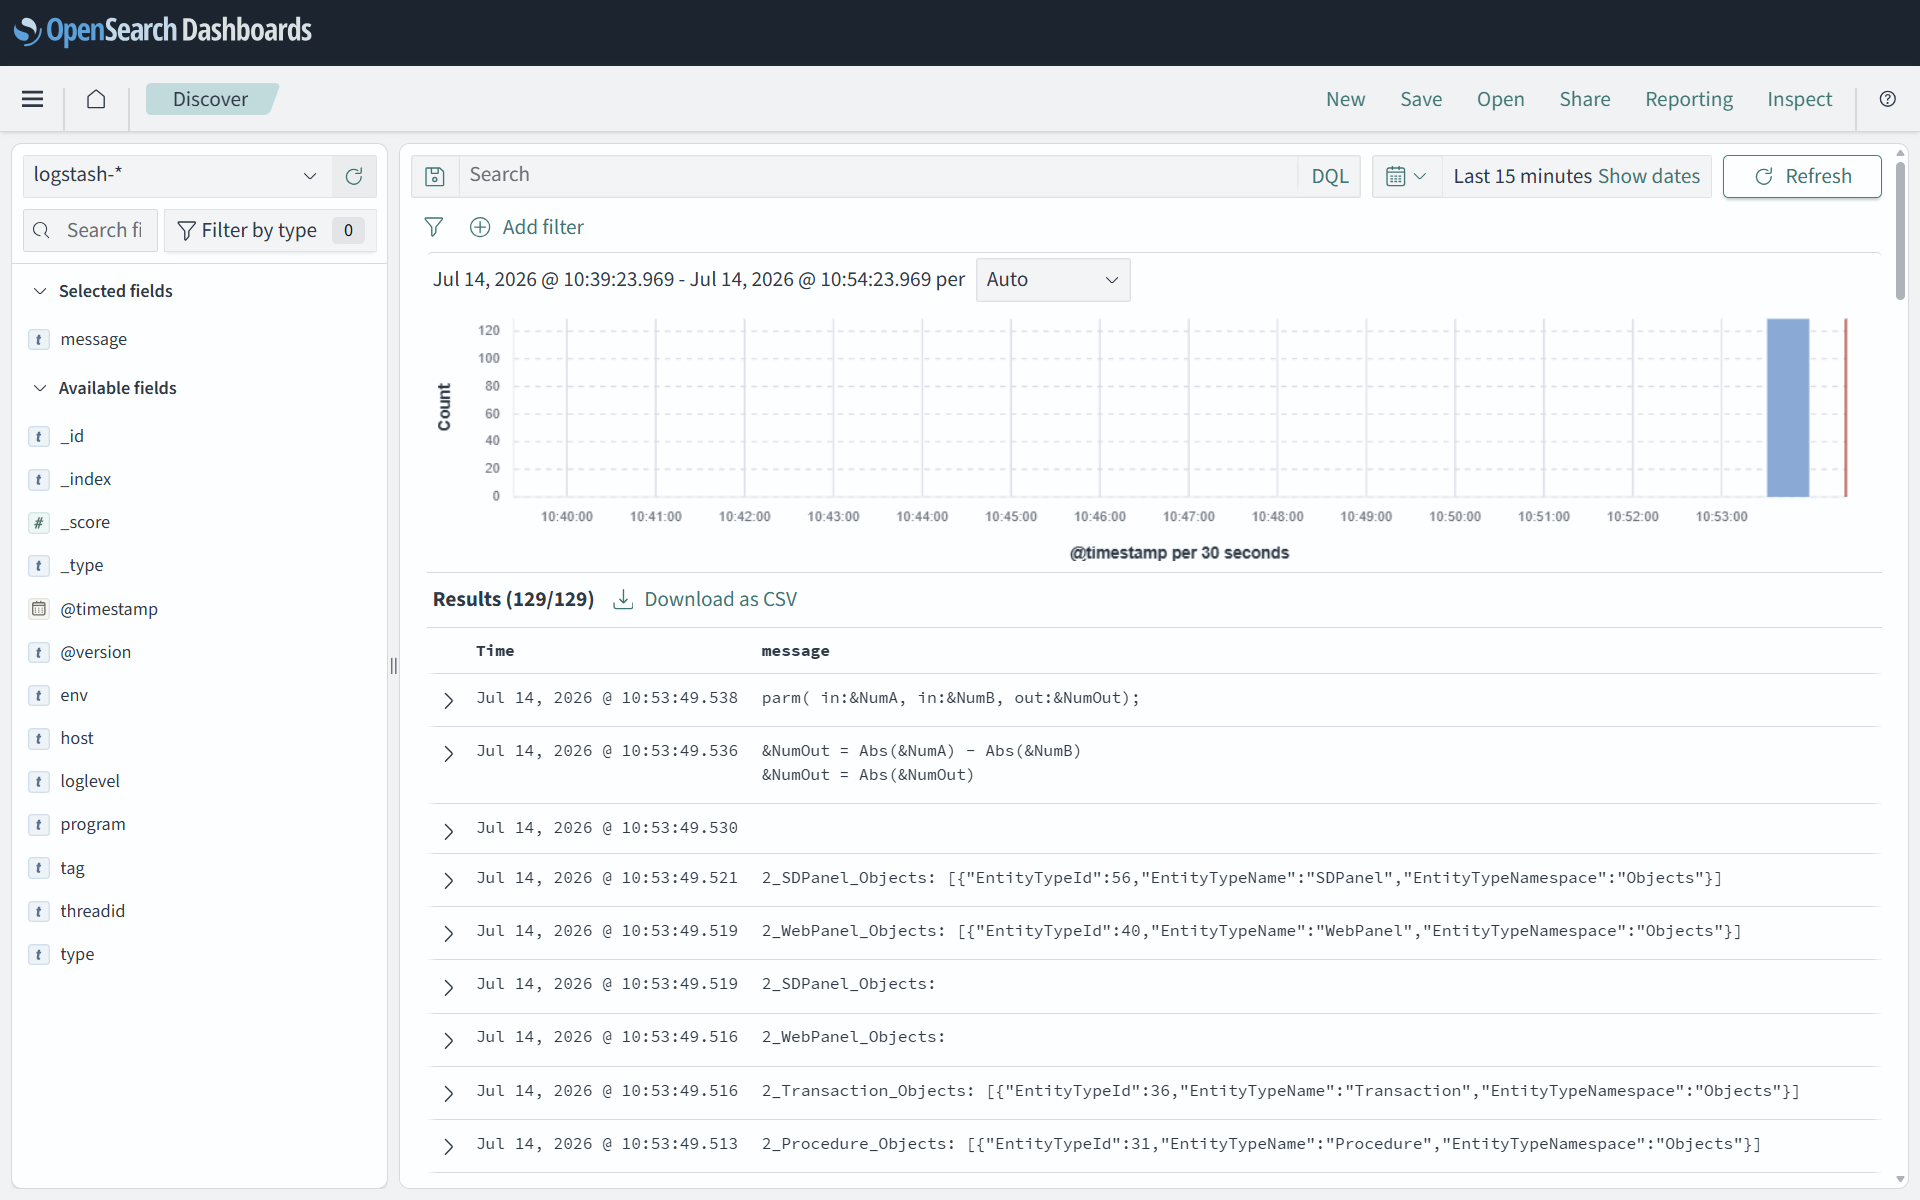
In May 2022 I published a guide for centralizing logs from Java, .NET and GeneXus applications. The goal was deliberately simple: stop chasing scattered files across servers and be able to search every event from a single interface.
The first version used Elasticsearch, Logstash and Kibana, and the repository was called log4kibana. On July 18, 2022 I switched the storage and visualization engine to OpenSearch and OpenSearch Dashboards; the next day I recorded the update in the original article.
That was the first milestone. The second came with how the project matured afterwards, especially between 2024 and 2026: automatic retention through ISM, explicit mappings, versioned dashboards, one-shot provisioning, health checks, and an optional path for logs and traces via OpenTelemetry.
Put differently:
I switched the engine to OpenSearch in July 2022, and over time the project evolved — retention, versioned dashboards and OpenTelemetry — into
log4opensearch.
The result is log4opensearch, an open source project for building a reproducible centralized logging platform for .NET, Java and GeneXus applications.
This article is not a second installation manual. The log4opensearch README is the canonical source for commands, configuration files, ports and troubleshooting. What interests me here is explaining why the solution ended up designed this way, what changed since 2022, and which lessons carry over to other platforms.
From log4kibana to log4opensearch: two complementary reasons
The 2022 migration had two drivers: licensing and project governance on one side, and fit for purpose on the other.
They are worth separating, because they did not carry the same weight or happen at the same moment.
1. Licensing and governance: the main reason in 2022
In January 2021, Elastic stopped publishing new versions of Elasticsearch and Kibana under the Apache License 2.0 and began distributing the code under SSPL and the Elastic License. Neither license was recognized as open source by the Open Source Initiative.
When I switched engines in July 2022, that situation had been in place for roughly a year and a half. At the time, OpenSearch was the alternative that kept the entire search and visualization base under Apache 2.0, a permissive open source license.
For a project meant to stay open, modifiable and reusable — including inside commercial solutions — the license was not a secondary legal footnote. It was part of the architecture.
Apache 2.0 offers valuable predictability: versions released under it can be used, modified, distributed and integrated into other products under its terms. A company or a community can keep building on that code even if one of its sponsors later changes strategy.
The context shifted again in 2024:
- in August, Elastic added AGPLv3 as an option for the free portion of the Elasticsearch and Kibana source, so both once again had an OSI-approved license available;
- in September, OpenSearch moved under the OpenSearch Software Foundation, hosted by the Linux Foundation, with vendor-neutral governance.
So it would be wrong today to simply claim Elasticsearch is proprietary. The current comparison is more nuanced: Elastic offers AGPLv3 alongside ELv2 and SSPL, while OpenSearch keeps every component under Apache 2.0 and is backed by an independent foundation.
The 2022 decision should be read with the information available in 2022: back then, new Elasticsearch and Kibana releases were no longer under an OSI-approved open source license, while OpenSearch did keep a fully Apache 2.0 base.
2. Fit for purpose: a read that was confirmed later
There was a second signal as well. Elastic was steering its offering more and more toward its managed cloud, positioning Elastic Cloud as the most direct route to new capabilities and to less platform operations work.
That does not mean self-managed deployment disappeared or became an invalid option. It means the product’s incentives and messaging were progressively concentrating on the managed experience.
For many companies that direction is reasonable: running a search, observability and security cluster at scale is not trivial, and consuming it as a service can be the best call.
But log4kibana had a different purpose. It aimed to offer a small, understandable, reproducible logging platform that could be brought up locally or inside an internal network with Docker Compose. It did not need to become a full enterprise platform or depend on a managed service.
Elastic’s later evolution confirmed that difference in goals. Since 2023, the company has broadened its positioning around a Search AI Platform combining search, observability, security, vectors and AI capabilities. That is a valid direction for a broad enterprise product, but it introduces capabilities, concepts and decisions well beyond the scope of a simple stack for centralizing logs.
I am not projecting that 2026 complexity back onto the 2022 decision as if it already existed in the same form. In 2022, the deciding argument was the license and the product’s direction signals. The platform’s later expansion simply confirmed that OpenSearch was a better fit for this project’s concrete scope.
What migrated and what stayed
I did not migrate “the whole Elastic Stack”. That framing would be inaccurate.
The change was:
Elasticsearch + Kibana
          ↓
OpenSearch + OpenSearch Dashboards
Logstash stayed in the pipeline. Its OSS distribution remained available under the Apache License 2.0 and kept doing a well-defined job: receive the messages, parse them with Grok patterns, and forward them to the storage engine.
The architecture therefore combined components with different origins:
- Logstash for ingestion and transformation;
- OpenSearch for indexing and search;
- OpenSearch Dashboards for exploration and visualization;
- Docker Compose to reproduce the environment.
That distinction also explains the current name. log4opensearch does not deny the pipeline’s origin or claim to replace every Elastic-related piece. It describes where the logs land and the interface used to analyze them.
The problem isn’t the files: it’s the missing context
While an application runs on a single server, opening a text file can feel like enough. But a real platform usually has several components:
- web applications;
- APIs;
- batch processes;
- Java and .NET services;
- multiple environments;
- multiple containers or servers;
- GeneXus applications living alongside services built with other technologies.
When an incident happens, finding an isolated exception is rarely enough. What we need to reconstruct is a sequence:
- which application produced the event;
- which environment it happened in;
- which server processed it;
- which operation or entity was involved;
- what happened before and after;
- whether the same pattern shows up on other nodes.
A file contains text. An observability platform should contain events with context.
That difference drives nearly every decision that follows.
From a working demo to a reproducible platform
The main architecture is still straightforward:
.NET / Java / GeneXus application
              │
              │ structured text logs
              ▼
          Logstash
              │
              │ indexed documents
              ▼
          OpenSearch
              │
              ▼
   OpenSearch Dashboards
Optionally, applications instrumented with OpenTelemetry use a separate path:
Application with OpenTelemetry
              │
              │ OTLP
              ▼
         Data Prepper
              │
              ▼
          OpenSearch
The project’s value is not just being able to start those containers. That part is relatively easy. The value is in automating what usually stays as a series of manual configurations:
- explicit mappings;
- a retention policy;
- index patterns;
- versioned dashboards;
- real health checks;
- idempotent provisioning through one-shot services;
- separation between traditional logs and OTLP telemetry.
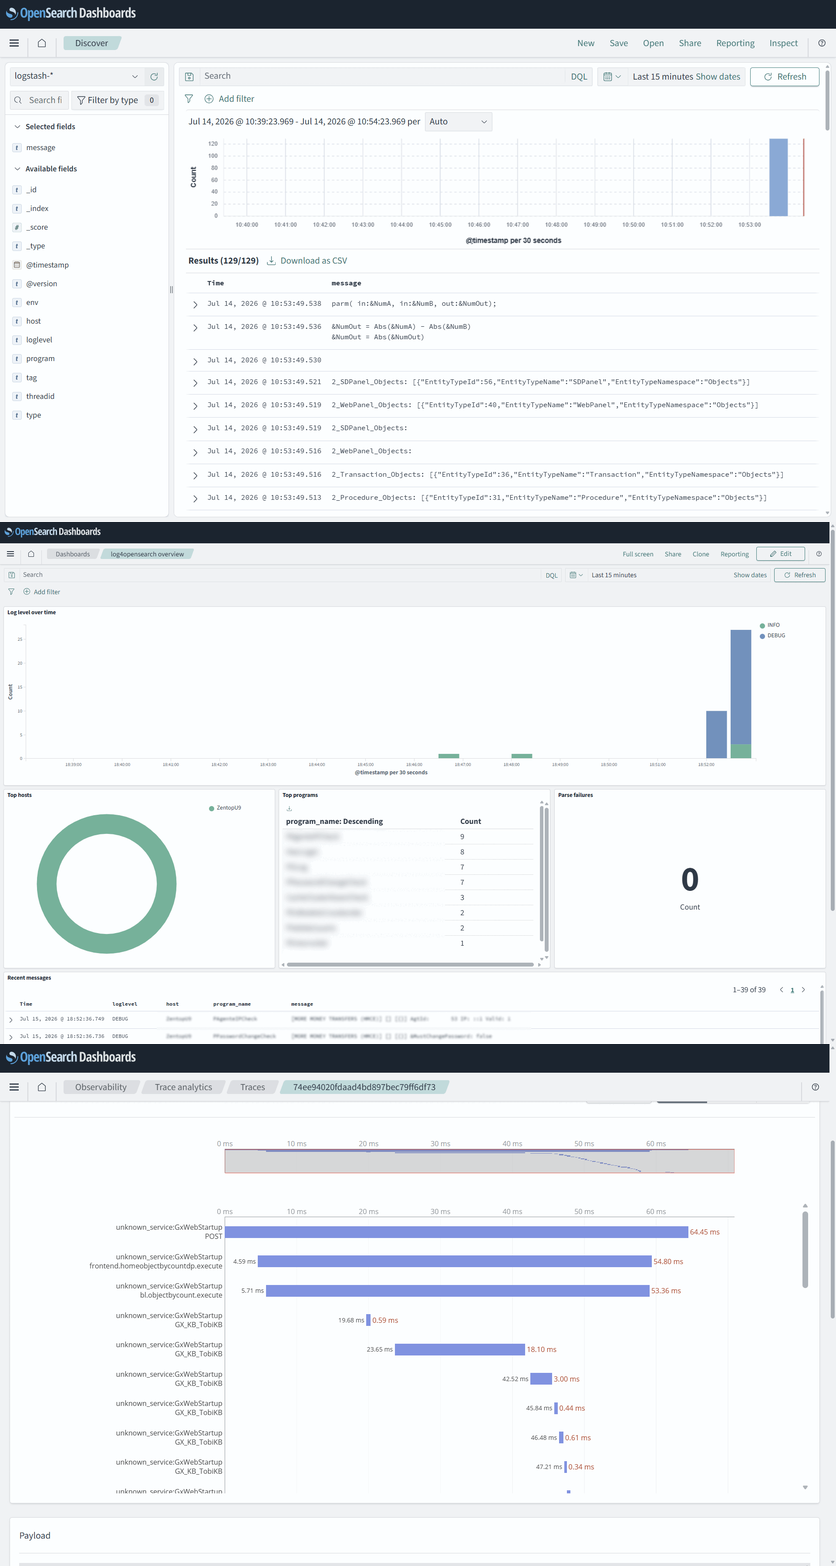
The dashboard is provisioned together with the stack and does not depend on manual configuration after installation.
First decision: the log format is an API
Many implementations treat log format as a presentation detail. In reality, once there is a pipeline parsing those messages, the format becomes a contract between the application and the infrastructure.
A useful event should not just say:
Failed to update customerIt should carry information that makes it filterable and correlatable:
timestamp | level | host | environment | application | traceId | program | entity | messageThe difference is operational. With the second format we can answer concrete questions:
- every production error from one application;
- every event tied to a given customer;
- the activity of a specific program;
- the messages belonging to a single operation;
- the hosts generating the most failures.
Two small details tend to cause hard-to-spot errors.
The time zone must travel with the event. A local timestamp with no offset is ambiguous. If the pipeline reads it as UTC, the log will appear shifted by hours and the timeline reconstruction will be wrong.
The encoding must be explicitly UTF-8. Otherwise, messages with accents, ñ or other characters can arrive corrupted even though the flow looks like it is working.
The current log4net and log4j2 configurations are maintained in the Configuring your application section of the repository. Keeping them there prevents this article from going stale whenever the technical contract changes.
Second decision: fail visibly, don’t lose information
Logstash uses Grok patterns to turn a text line into structured fields. The project recognizes several formats and evaluates the most specific ones first.
Order matters: a generic pattern could prematurely accept a richer line and keep the message while losing fields like the program, the entity or the trace identifier.
There is another relevant decision: when a line matches no pattern, the event is not discarded.
The original text is kept and a parse-failure tag is added. That way an unexpected layout change does not create a silent hole in the data. The team can search for those events, see what format actually arrived, and fix the pipeline.
This principle applies well beyond Logstash:
When an input can’t be structured, degrade the quality of the data rather than dropping it without leaving evidence.
Third decision: mappings shouldn’t depend on the first event
OpenSearch can infer each field’s type automatically. That convenience works right up until two producers use the same name with different structures.
A typical example is host:
- one application sends it as text;
- another ECS-compatible tool tries to send it as an object with inner properties.
The first document defines the mapping. The second can end up rejected, because a field can’t be both text and an object.
That’s why log4opensearch installs explicit mappings and keeps a flat schema for logs processed by Logstash. It also disables ECS compatibility at the points in the pipeline where it could transform those fields automatically.
The lesson is not that ECS is wrong. ECS is useful when adopted consistently. The problem shows up when conventions get mixed inside the same index without a conscious decision.
An explicit schema offers three advantages:
- it keeps the first document from deciding the system’s structure;
- it reduces conflicts between producers;
- it turns data evolution into a versionable decision.
Fourth decision: dashboards are code too
In an early proof of concept it’s normal to create the index pattern and the visualizations by hand. In an environment that must be rebuildable, that manual setup becomes operational debt.
If the platform’s knowledge lives only inside one OpenSearch Dashboards instance, several problems appear:
- a fresh install doesn’t reproduce the previous environment;
- each environment ends up showing different information;
- changes never go through review;
- nobody knows exactly which configuration is the right one;
- a reinstall means repeating a sequence of clicks.
The repository exports and versions the Dashboards objects, and imports them automatically once the service is genuinely available. The objects use stable identifiers, so they can be updated without creating duplicates.
This turns the visualizations into part of the product.
The dashboard is not decoration bolted onto the infrastructure. It is the interface the team uses to investigate incidents, spot trends and verify the quality of the data coming in.
Fifth decision: retention is part of the design
Every logging platform grows cumulatively. With no expiration policy, the only real policy is waiting for the disk to fill up.
log4opensearch creates time-based indices and applies an Index State Management policy to delete old data. The period can be adjusted from the environment configuration.
The right number of days depends on each organization:
- daily volume;
- available space;
- typical investigation windows;
- audit requirements;
- how sensitive the information is;
- contractual or regulatory policies.
The important decision is that retention be explicit and automatic.
It’s also worth remembering that keeping more is not always better. Logs can include identifiers, parameters, business data or information that shouldn’t live indefinitely. Observability needs a data policy, not just storage capacity.
Sixth decision: UDP is a trade-off, not a guarantee
The project’s traditional path receives logs over UDP. The choice has clear upsides:
- simple configuration;
- low overhead;
- the application doesn’t wait for a response;
- broad support in log4net and log4j2.
But UDP guarantees no delivery, no ordering and no retries. If the port is blocked, the network fails, or Logstash isn’t listening yet, the sender gets no confirmation.
So this mechanism works well in development, labs and many internal environments, but it shouldn’t be mistaken for a durable queue.
When events carry legal, financial or security value, it’s worth evaluating mechanisms with buffering, acknowledgement and retry. The architecture should answer to the cost of losing an event, not just to how easy it is to send one.
From centralized logs to distributed traces
Logs explain what each component recorded. Traces try to reconstruct how an operation crossed several components and how much time each leg took.
That’s why the project includes OpenTelemetry as an optional profile and keeps its data on a path separate from the traditional pipeline.
This separation avoids forcing an all-or-nothing migration. An organization can have, at the same time:
- existing applications still shipping logs via log4net or log4j2;
- new services emitting traces and logs over OTLP;
- a single OpenSearch instance to explore both contexts.
The move toward OpenTelemetry can be gradual, but there’s an important conceptual distinction: adding a collector doesn’t create observability by itself. A trace’s depth depends on the spans the application — or its instrumentation — actually generates.
The stack can store and visualize what it receives. It can’t invent context the code never emitted.
The distinction that matters for GeneXus applications
The repository grew out of a GeneXus implementation and keeps a folder with configurations and an XPZ of helpers for structured logging.
For GeneXus applications using the traditional path, the flow is the same as for any other .NET or Java application: the logger produces the event and Logstash processes it.
With OpenTelemetry there’s a difference worth stating explicitly.
GeneXus .NET: OpenTelemetry replaces log4net
When the .NET generator’s Observability Provider is set to OpenTelemetry, GeneXus stops using log4net for that application.
As a result:
- that application no longer feeds Logstash’s UDP path;
- its logs and traces are sent over OTLP instead;
- both mechanisms do not coexist inside that same .NET application.
Coexistence happens between applications. A platform can, for example, keep legacy applications sending log4net while migrating others to OpenTelemetry. log4opensearch can receive both flows at once because it processes them through different paths.
The Java generator behaves differently: log4j2 remains available and can be used alongside OpenTelemetry instrumentation and trace-identifier correlation.
The concrete steps, configuration variables and the LogAdd and LogAddTag helpers live in the GeneXus appendix of the README, where they can evolve alongside the code.
The line between lab and production
The project prioritizes a frictionless start. By default, security is disabled and the endpoints should not be exposed to an untrusted network.
Before running a stack like this in production, you need to consider at least:
- authentication and authorization;
- TLS;
- restricting ports with a firewall;
- private access to Dashboards;
- safe credential handling;
- backups when the history matters;
- disk and memory alerts;
- a review of sensitive data included in the logs.
An observability platform concentrates details about the architecture, the errors and the system’s internal activity. That information deserves the same protection as any other sensitive technical asset.
What belongs in the article and what belongs in the repository
Separating responsibilities also makes the content easier to maintain.
This article tries to answer architecture questions:
- why OpenSearch instead of staying on Elasticsearch and Kibana?
- why structure the logs?
- why define mappings?
- why keep parse failures?
- why version the dashboards?
- what trade-off does UDP imply?
- how do you live alongside OpenTelemetry?
The repository answers the operational questions:
- how to bring the stack up;
- which ports it uses;
- how to configure log4net and log4j2;
- how to send a test event;
- how to adjust retention;
- how to solve common errors.
That split avoids maintaining two manuals that would inevitably end up contradicting each other.
To try the implementation, check the current configurations or read the code, the entry point is the log4opensearch README.
Conclusion
The project started in May 2022 as log4kibana, a quick way to ship logs to Elasticsearch and Kibana. In July of that same year I switched the engine to OpenSearch and OpenSearch Dashboards, keeping Logstash as the ingestion component.
The main reason at the time was the license: I wanted the project’s foundation to stay on permissively licensed open source technology. There was also a question of fit: for a small, local, reproducible logging platform, OpenSearch pointed in a direction better aligned with what I wanted to build.
What came later shouldn’t be confused with the moment of migration. Between 2024 and 2026 the project matured with ISM retention, explicit mappings, versioned dashboards, automatic provisioning and OpenTelemetry. That second stage is what finally turned log4kibana into log4opensearch.
The experience also showed that centralizing logs is only the beginning. A sustainable solution has to define an event contract, keep the entries it can’t parse, control the schema, automate retention, version the visualizations and set a clear path toward distributed traces.
log4opensearch leaves those decisions visible in a small, runnable, modifiable repository. It can serve as a lab, a starting point for an internal implementation, or a reference for designing a broader observability platform.